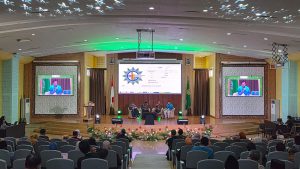
Menuju Kampus Berkelanjutan, Unismuh Bahas Setting dan Infrastruktur pada UI GreenMetric UIN Sunan Kalijaga 29 April 2026
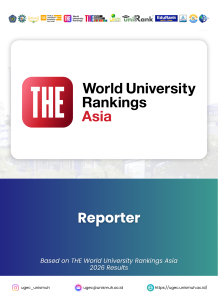
Universitas Muhammadiyah Makassar Catatkan Langkah Awal sebagai Reporter dalam THE World University Rankings Asia 2026 22 April 2026
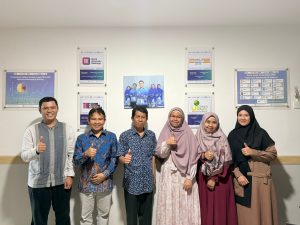
Diskusi Pemeringkatan, Dosen Universitas Muhammadiyah Palopo Kunjungi Unismuh Global Excellence Center 11 April 2026